Opening The Rift
therift
© 2026 The Rift. All Rights Reserved.
India’s Schools, By the Numbers: What NITI Aayog’s 2026 Report Reveals and Glosses Over
India’s school system succeeds at enrolment but struggles to teach, a paradox NITI Aayog’s 2026 report surfaces.

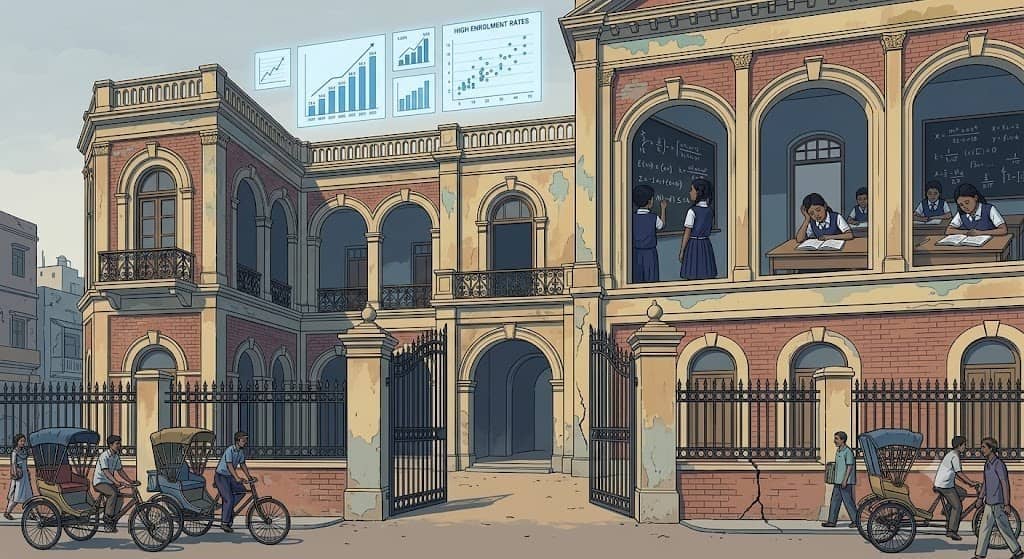
Students attend a class in India, as the country’s education sector continues to evolve (Representative Image)
Key Takeaways
1 of 3
Automatically generated. Read full article for complete context.
On May 6, 2026, NITI AayogNational Institution for Transforming IndiaA policy think tank of the Government of India, established to achieve sustainable development goals with cooperative federalism by fostering the involvement of State Governments of India in the economic policy-making process. released a 233-page policy document titled “School Education System in India: Temporal Analysis and Policy Roadmap for Quality Enhancement.” Unveiled by Vice Chairman Suman Bery and CEO Nidhi Chhibber, the report offers a decade-long, state-by-state audit of the world’s largest school system and, in doing so, surfaces a paradox that has quietly defined Indian education policy for years: a system that has succeeded spectacularly at getting children through the school gate, and struggled just as consistently to teach them much once they’re inside it.
The Scale, and the Shape, of the Problem:
The headline numbers are staggering. India’s school system spans 14.71 lakh schools serving over 24.69 crore students more than the population of most countries. The report draws on a genuinely wide evidentiary base: UDISE+ 2024-25, the PARAKHPerformance Assessment, Review, and Analysis of Knowledge for Holistic DevelopmentIndia’s first national assessment regulator, established under the National Education Policy 2020, to set norms, standards, and guidelines for student assessment and evaluation. Rashtriya Sarvekshan 2024, the National Achievement Survey (NASNational Achievement SurveyA large-scale sample-based survey conducted by the Ministry of Education to assess the learning achievement of children in various grades across different subjects.) rounds of 2017 and 2021, and household data from ASERAnnual Status of Education ReportA nationwide survey of rural education and learning outcomes in India, conducted by the NGO Pratham, providing data on children’s foundational reading and arithmetic abilities. 2024, cross-checked against a National Workshop on Quality School Education that NITI Aayog convened in February 2025 with over 150 participants, including state education secretaries, NCERT and SCERT directors, district collectors, and UNESCO representatives.
But scale, the report itself concedes, has not translated into structural coherence. One of its more striking findings concerns what analysts have described as a “pyramid problem”: India has roughly 7.3 lakh primary schools, but that number collapses to just 1.64 lakh by the higher secondary stage, and only about 5.4 percent of schools offer an unbroken educational pathway from Grade 1 through Grade 12. Every transition between stages primary to upper primary, upper primary to secondary becomes a chokepoint where children are more likely to fall out of the system altogether. Consistent with this, the national Gross Enrolment RatioGERA statistical measure used in the education sector to show the number of students enrolled in a given level of education, regardless of age, as a percentage of the official school-age population for that level., which is near-universal at the elementary level, falls to roughly 58.4 percent by the higher secondary stage, according to summaries of the report.
The Enrolment Shift Nobody Wants to Own:
Perhaps the most politically sensitive finding is the collapse in government school enrolment share, which the report puts at 49.24 percent for 2024-25 down from 71 percent in 2005 even as private unaided schools have expanded their share of secondary institutions to roughly 44 percent. The report attributes this shift primarily to parental perceptions that private schools offer better discipline, English-medium instruction, and stronger employability outcomes, a reading echoed in press coverage of the release.
What the report is considerably quieter about, according to independent analysts, is the mechanism behind that enrolment shift: the actual closure and merger of government schools. Prof. Arun C. Mehta, a longtime educational statistician formerly with NIEPANational Institute of Educational Planning and AdministrationA premier organization dealing with capacity building and research in educational planning and administration, funded by the Ministry of Education, Government of India., has argued that UDISE+ data shows an absolute reduction in the number of government schools across 31 states and union territories, with Jammu and Kashmir alone reportedly losing several thousand schools to consolidation. If that critique holds, it complicates NITI Aayog’s own framing: some of the “shift toward private schools” may be less a story of parental choice than of children losing access to a nearby government school in the first place, with second-order effects for last-mile schemes such as PM-POSHANPradhan Mantri Poshan Shakti NirmanA centrally sponsored scheme in India that provides one hot cooked meal in government and government-aided schools, replacing the Mid-Day Meal Scheme. meal entitlements, free textbook and uniform distribution, and reimbursements under Section 12(1)(c) of the Right to Education ActThe Right of Children to Free and Compulsory Education Act, 2009An Act of the Parliament of India that mandates free and compulsory education for children between 6 and 14 years in India under Article 21A of the Indian Constitution. Section 12(1)(c) mandates 25% reservation for economically weaker sections in private unaided schools..
Learning Outcomes: The Harder Story Beneath the Access Story:
If enrolment numbers make for an ambivalent headline, the learning outcomes data is more unambiguously troubling. The report notes that the share of Grade 8 students able to read a Grade 2-level text has actually declined over the past decade from roughly 74.7 percent in 2014 to about 71.1 percent by 2024, according to figures cited in coverage of the report. In mathematics, the picture appears starker still: only around 45.8 percent of Grade 8 students, per the cited figures, can solve a basic division problem, and PARAKH 2024 data reportedly shows fewer than 30 percent of Grade 6 students demonstrating competence with fractions evidence, the report suggests, of a system where students can often reproduce rote procedures without being able to apply underlying concepts. Separately, ASER 2024 findings referenced alongside the report indicate that nearly half of Grade 5 children in rural India still cannot read a Grade 2-level text—a figure with obvious implications for the entire foundational literacy and numeracy push under the NIPUN Bharat MissionNational Initiative for Proficiency in Reading with Understanding and NumeracyA national mission launched by the Government of India to create an enabling environment to ensure foundational literacy and numeracy for every child by Grade 3 by 2026-27..
Enrolment & Learning Outcome Shifts in Indian Education
| Indicator | Earlier Data / Baseline | Latest Data / Current Status |
|---|---|---|
| Government School Enrolment Share | 71% (2005) | 49.24% (2024-25) |
| Higher Secondary Gross Enrolment Ratio (GER) | Near-universal (Elementary) | 58.4% (Higher Secondary) |
| Grade 8 Students Reading Grade 2 Text | 74.7% (2014) | 71.1% (2024) |
| Grade 8 Students Solving Basic Division | N/A | 45.8% (2024) |
| Grade 6 Students Competent with Fractions | N/A | <30% (PARAKH 2024) |
| Rural Grade 5 Children Unable to Read Grade 2 Text | N/A | Nearly Half (ASER 2024) |
VISUALS BY THE RIFT
The report does register some cause for cautious optimism: it points to gains in foundational literacy and numeracy in the years immediately following the pandemic-era disruption, crediting the National Education Policy (NEP) 2020India’s New Education PolicyA comprehensive framework for education in India, aiming to transform the country’s education system from school to higher education, replacing the 1986 policy., NIPUN Bharat, and the Samagra Shiksha AbhiyanIntegrated Scheme for School EducationAn overarching program of the Government of India for the school education sector extending from pre-school to senior secondary levels, aiming for holistic development. for stabilising outcomes that had cratered during school closures. Whether this represents durable recovery or a low base effect is not something the underlying data can fully settle, and the report itself frames the gains as encouraging rather than conclusive.
Infrastructure and the Digital Divide:
On school infrastructure, the report is comparatively upbeat, documenting real advances in electricity access, functional sanitation, and infrastructure for children with disabilities over the past decade, alongside expansion of computers, internet connectivity, and smart classrooms. But this progress is markedly uneven across states a pattern the report’s own heat maps appear designed to expose. Functional smart classrooms reportedly exist in over 95 percent of schools in Chandigarh, against fewer than 5 percent in Meghalaya—an illustration of the kind of interstate disparity that a single national average would otherwise conceal. More than a lakh schools nationally are still reported to be run by a single teacher, a structural constraint that makes any serious talk of individualized, competency-based pedagogy somewhat theoretical in practice.
Equity Gains, With Caveats:
The report also documents encouraging movement on equity indicators rising girls’ participation and improved enrolment among Scheduled Caste and Scheduled Tribe students across educational stages, gains it links to sustained policy attention over the NEP 2020 period. These findings are less contested in early commentary than the enrolment-share and learning-outcome numbers, though it is worth noting that participation gains do not, on their own, tell us whether equity in outcomes as opposed to access has kept pace.
The 13-Point Roadmap:
Rather than stopping at diagnosis, the report sets out a policy roadmap comprising 13 recommendations, split into eight systemic reforms and five academic ones. On the systemic side, it proposes consolidating fragmented schools into composite institutions spanning Grades 1 to 12, backed by “evidence-based rationalization”; establishing independent State School Standards Authorities (SSSAs) to oversee safety and infrastructure benchmarks; setting up State and District Task Forces on School Quality; strengthening School Management Committees; and reforming teacher deployment and professional development—an implicit acknowledgment of the report’s own findings on single-teacher schools and uneven staffing. The academic recommendations focus on shifting pedagogy and assessment away from rote recall, integrating Teaching-at-the-Right-Level and diagnostic, competency-based models, strengthening Early Childhood Care and Education, and notably building in AI-enabled learning tools to personalise instruction.
The roadmap is unusually granular for a NITI Aayog document: it lays out 33 implementation pathways, each assigned to specific short-, medium-, and long-term horizons with named actors at the Central, State, and local levels, and backs the whole framework with over 125 measurable Performance Success Indicators intended to let policymakers actually track progress rather than simply restate ambition.
What the Roadmap Doesn’t Quite Resolve:
Whether this level of granularity converts into implementation is, as with most such roadmaps, an open question that the report cannot itself answer school education sits substantially within state jurisdiction under India’s constitutional scheme, and NITI Aayog’s own recommendations depend heavily on state-level political will and administrative capacity that vary enormously, per the report’s own heat maps, from Chandigarh to Meghalaya. Independent commentators have also flagged that a document weighted so heavily toward enrolment share risks understating the more uncomfortable finding buried in its own annexes: that the public school network itself, measured in raw numbers of functioning institutions, has been shrinking in more than thirty states and union territories even as the report emphasizes consolidation as a considered policy choice rather than an already-occurring trend.
None of this negates the report’s underlying value as a diagnostic instrument the scale of data assembled across UDISE+, NAS, PARAKH, and ASER is not something previously compiled in one place with this degree of temporal comparability. But as with much recent Indian policy documentation, the space between a well-evidenced roadmap and its execution on the ground, across 36 states and union territories with wildly divergent starting points, is likely to be where the report’s actual legacy gets decided.
Disclaimer:The views and opinions expressed in this article are those of the author(s) and do not necessarily reflect the official policy or position of The Rift.